Housekeeping: This is the last chapter for SL and HL content. Everything we do after today will be related to your semester final, IA, or prep for mock exams in February. I won't cover Option C Energy until after mock exams.
Content Review:
Textbook: Chapter 11.3
Links: Understanding Chemistry Virtual Textbook
Student Missions:
Mission 1: Peep This...
Mission Objectives. You should be able to...
1. Determine the IHD from a molecular formula.
2. Deduction of information about the structural features of a compound from percent composition data, MS, IR, or 1H NMR.
Degree of Unsaturation (Index of hydrogen deficiency [IHD]) can be used to determine from a molecular formula the number of rings or multiple (pi) bonds in a molecule.
Double bonds are counted as ONE degree of saturation
Triple bonds are counted as TWO degrees of saturation
A ring is counted as ONE degree of saturation
An aromatic ring is counted as FOUR degrees of saturation
IHD can be worked out two ways: from the structure itself or from the molecular formula. Watch the below video from Richard Thornley. Be sure to write down the formula he uses, as it is easier than the one in your text.
Again, the point is to determine the number of rings or multiple bonds in a molecule.
Spectroscopy is the study of light and matter. It's used to gather data about what the structure of a molecule might be. There are two main types of light spectroscopy: IR and NMR.
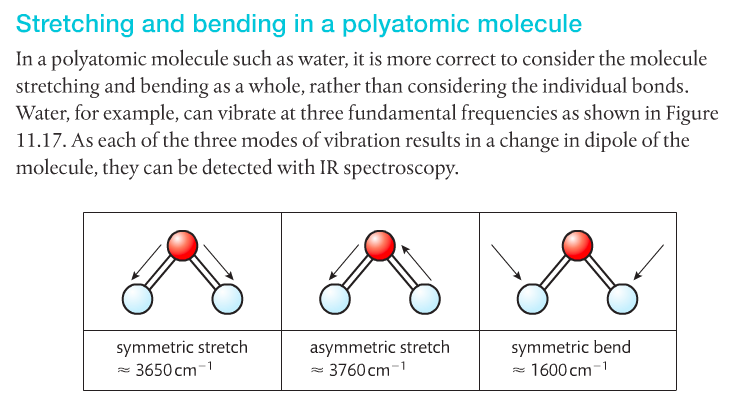
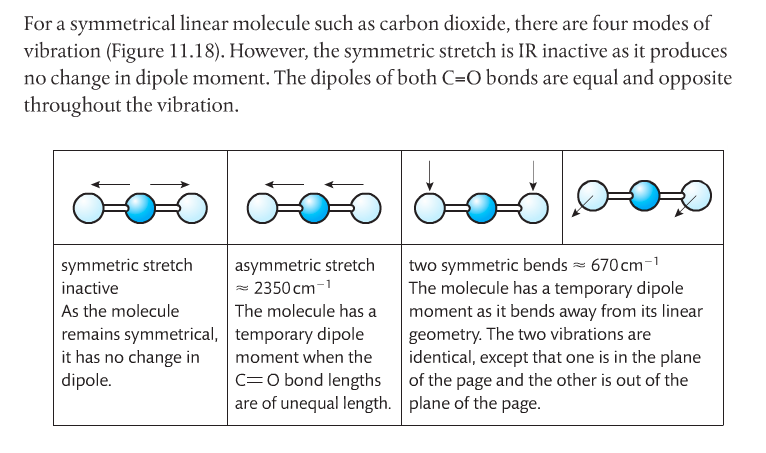
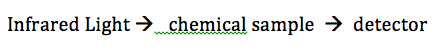
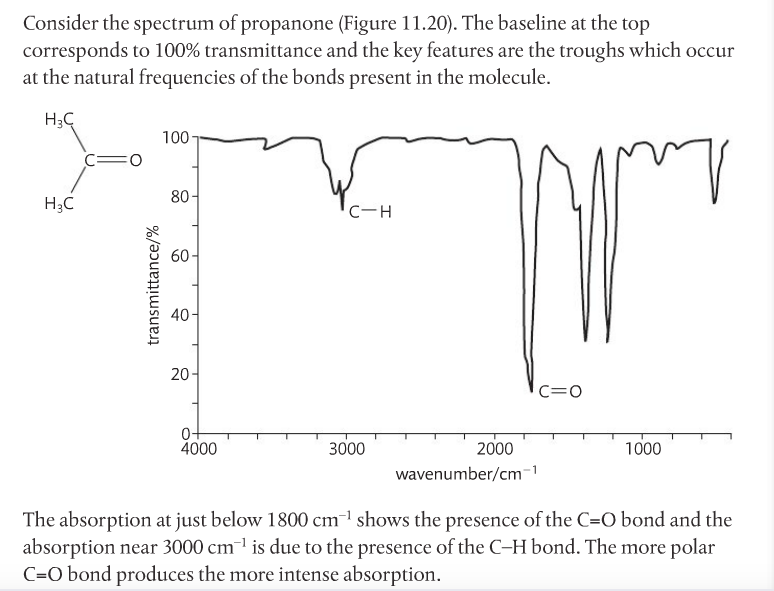
Infrared Spectroscopy. IR light is passed through a sample and to a detector (see first image below). Some of the light is absorbed by the sample, some isn't, and some of the light passes through to reach the detector. IR light is used because it makes molecules vibrate in certain ways: symmetrical, asymmetrical, stretching and bending. This happens at particular energies. Very specific wavelengths of light are absorbed and it varies depending on the functional groups in the chemical sample.
Spectroscopy is the study of light and matter. It's used to gather data about what the structure of a molecule might be. There are two main types of light spectroscopy: IR and NMR.
Infrared Spectroscopy. IR light is passed through a sample and to a detector (see first image below). Some of the light is absorbed by the sample, some isn't, and some of the light passes through to reach the detector. IR light is used because it makes molecules vibrate in certain ways: symmetrical, asymmetrical, stretching and bending. This happens at particular energies. Very specific wavelengths of light are absorbed and it varies depending on the functional groups in the chemical sample.
The identity of atoms will affect the photon of absorption and looking at an IR spectrum can show this (see second image below).
Image courtesy of www2.chemistry.msu.edu
Image courtesy of www2.chemistry.msu.edu
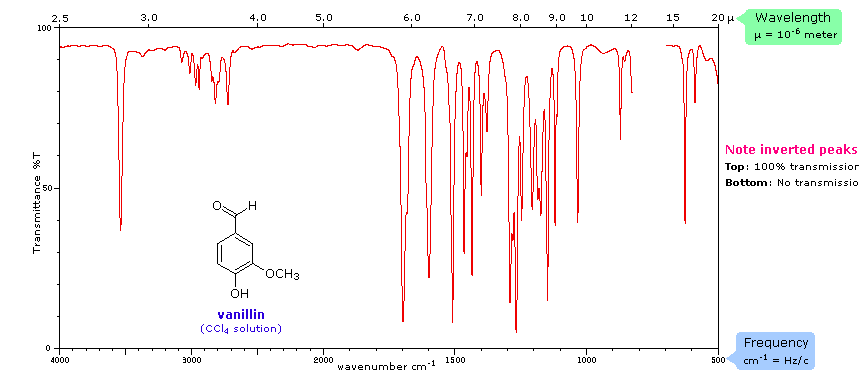
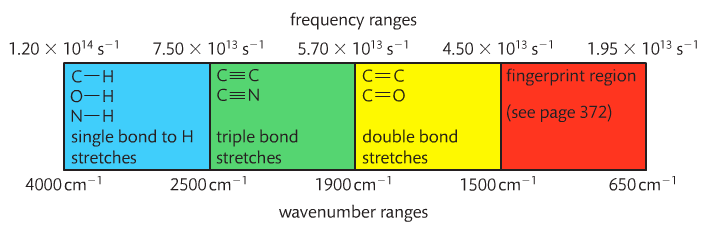
The x-axis is the wave number (cm-1)(v). It tells us the particular energy of IR light used. The y-axis is the percent transmittance. It tells us the percentage of that particular wave number that passes through the sample and reaches the detector. 100% means all IR light corresponding to that wave number is getting through the sample and reaching the detector. Dips on the graph have low transmittance, which means the light was absorbed by something in the sample. This "something" is a functional group.
This link provides a list of functional groups and their respective vibrational movements at certain energies. Professor Dave, aka Chemistry Jesus, explains.
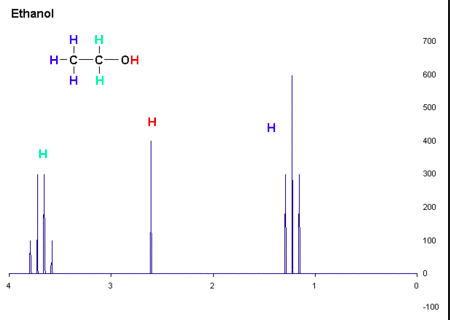
NMR Spectroscopy. Certain atomic nuclei that exhibit nuclear spin can be subjected to an external magnetic field. The spectroscopic data comes from this. Using 1H (protium), the sample is irradiated and the data shows the precise chemical environment of every single proton (H nucleus) in the molecule.
Image below is from wikipedia.
Image below is from wikipedia.
There are three factors that must be understood:
(1) A chemical shift describes the chemical environment. Anywhere there is a hydrogen atom, there is chemical information about that hydrogen's environment. The closer that proton is to an electronegative element, said element will have a de-shielding effect (electrons move away from the nucleus), the further downfield the signal will be. Examining the graph above, downfield is to the left and upfield is to the right. Downfield is closer to electronegative elements and upfield is farther away from electronegative elements.
(2) Integration is the area under the curve (what we're seeing is a grossly simplified example). How big is the resonance? How many chemically equivalent 1H (protons) are generating the peak?
(3) Splitting. Resonance will split into smaller peaks, depending on neighboring protons. This uses the n + 1 rule where "n" is the number of neighbor protons.
Professor Dave goes into detail and provides an example for you to work through and understand.
Mass Spectrometry. When a gaseous molecule is ionized, its molecular ion M+ is formed. The molecular ion peak in a mass spectrum correspond to the molecular mass of the compound. A molecule can break up into smaller particles, some of which will be ions. The fragmentation pattern observed in a mass spectrum provides further information on certain functional groups present in a molecule.
You can use mass spectroscopy to determine the relative mass of a compound and use the fragmentation patterns to determine the molecular structure. Table 28 in your Data Booklet shows the fragments that can be lost based on mass. A loss of a CH3 group corresponds to a mass of 15 (12 + 3). A loss of an OH group corresponds to a mass of 17 (16 + 1). A loss of a COOH group corresponds to a mass of 45. Watch the below video with Richard Thornley. Start at 2:30 and watch until the end.
The below video is for HL only.
 RSS Feed