Housekeeping: Good afternoon. Welcome to the Mad!Lab!
Agenda:
Welcome
Introduction to the course
Class procedures
Housekeeping (5 min)
Warmup & review (10 min)
Missions (20-25 min)
Wrap-up/homework (5 min)
Navigating the website (Where to find…?)
Content Review:
Atomic Theory Structure Electron Behavior Electron Configuration
Student Missions
Mission 1: Itty Bitty Things.
Mission Objectives: You should be able to...
1. Describe the structure of an atom.
2. Describe how radioisotopes are used in medicine.
All neutral atoms contain the same number of protons & electrons. The number of protons determines the element's identity. For instance, 8 protons = oxygen. 17 protons = chlorine. 20 protons = calcium. This does not change.
Electrons determine chemical behavior. Valence electrons (electrons in the outermost energy levels) are significant in this regard, because the number of valence electrons determine how an element behaves in certain conditions. Elements with an octet (8 valence electrons) are unusually stable and do not combine to form compounds (noble gases have an octet, with the exception of helium).
Neutrons determine isotopes. They do not affect the charge or the element's identity. However, they do affect the mass of the nucleus. Several elements have multiple isotopes. Almost every element has isotopes, and what is represented on the periodic table is an average of all of the isotopes of a particular element (which is why the atomic mass is a decimal). In a later mission, you will learn how to use mass spectrum data to calculate relative atomic mass (RAM).
This is basic structural information about the atom; what we know for sure. We also suspect something else: that subatomic particles are made up of quarks and all particles have anti-particles that, when they collide, release energy in the form of gamma rays.
Mr. Andrew Weng breaks down the entirety of section 2.1. He's not the most exciting lecturer, but he's comprehensive.
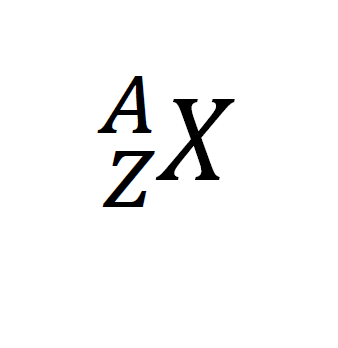 | The atomic number, Z: This is the number of protons in the nucleus. Neutral atoms have the same number of protons and electrons. The mass number, A: This is the number of protons and neutrons in the nucleus. Nucleons are the collective name for the subatomic particles in the nucleus. The element symbol, X: This is the symbol of the element that is on the periodic table. |
Radioisotopes (radioactive isotopes) are used in nuclear medicine for diagnostics, treatment and research. They are also used as tracers in biochemical and pharmaceutical research and as chemical clocks in geological and archaeological dating.
Mission 2: Back That Mass Up!!!
Mission Objectives: You should be able to...
1. Define "relative atomic mass".
2. Explain how a mass spectrometer works.
Relative atomic mass is defined as the ratio of the average mass of an atom to the unified atomic mass unit (1 amu). The book defines 1 amu as 1.6605402 * 10^-27.
A mass spectrometer can be used to measure the mass of individual atoms and the relative atomic mass of an element. Because the mass of an atom is ridiculously small (duh!), we use relative values according to an agreed-upon standard. Carbon-12 is the standard by which all atoms are measured (so I'm sure you can imagine that makes carbon a snarky element who doesn't get invited to the good parties).
There are five stages in this process: vaporization, ionization, acceleration, deflection and detection. You should be able to explain what happens at each stage.
Paul Anderson of Bozeman Science goes into detail about mass spectrometry. We will start the video at 1:45, unless you want to hear about John Dalton's contributions to chemistry (we will get to this shortly).
 | When mass spec data is produced, it is in the form of a mass spectrum. The X-axis shows the mass/charge ratio of the different ions on the C-12 scale, which is considered almost equal to their mass. The Y-axis shows the relative abundance of the ions. Image courtesy of chemguide.co.uk |
Mission 3: Color Me BADD!!
Mission Objectives. You should be able to...
1. Explain the phenomenon of emission spectra.
2. Describe the line emission spectrum of hydrogen and its relationship to the Bohr Model.
3. Determine how an atom is structured based on its energy level(s).
The electromagnetic spectrum is a visualization of electromagnetic radiation. It ranges from low energy radio waves to high energy gamma rays. All eMag waves travel at the same speed (c) but are distinguished by their different wavelengths (greek letter lambda). Different colors of visible light (the sliver of the spectrum we can see) have different wavelengths. There is a full eMag spectrum in your Data Booklet.
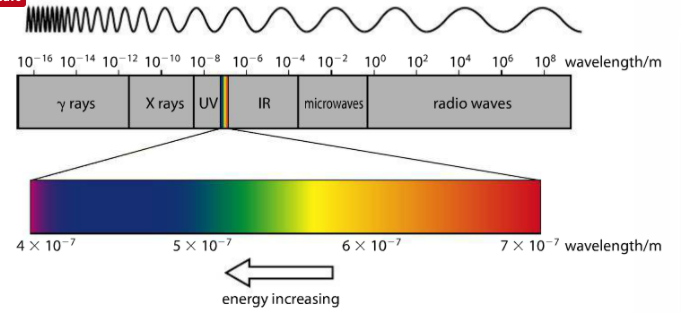
The above image from the Pearson text (p. 71) shows the changing wavelength of the eMag spectrum in meters (m). On the left side, we have high energy gamma waves, which have the shortest wavelengths, and on the right side, we have radio waves, which have the longest wavelengths. The sliver of color between UV and IR is what our eye sees, magnified as the bar of color directly above.
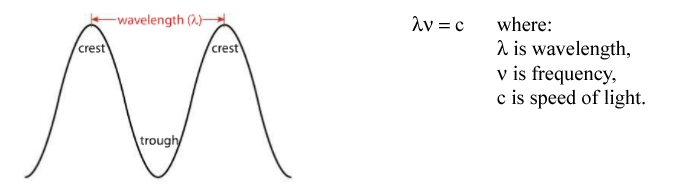
Wavelength is measured from the crest (or trough) of one wave to the crest (or trough) of another. The number of waves that pass a given point at any time is called frequency. The relationship between frequency and wavelength is inverse: the shorter the wavelength, the higher the frequency.
Wavelength is measured from the crest (or trough) of one wave to the crest (or trough) of another. The number of waves that pass a given point at any time is called frequency. The relationship between frequency and wavelength is inverse: the shorter the wavelength, the higher the frequency.
| When eMag radiation is passed through atoms, some of the radiation is absorbed and used to excite the atoms from low energy levels to high energy levels. The mass spectrometer analyses the transmitted radiation relative to the incident radiation and an absorption spectrum is produced. Absorption spectra show colors with black lines and the black lines represent where the energy is absorbed. Emission spectra result when a high voltage is applied to the gas. Emission spectra show black with a few colored lines. The colored lines are the same as those that are missing from the absorption spectrum. They read like bar codes to identify unknown elements. Mr. Anderson is on the case. SL can stop watching around 3 minutes in, but HL must watch the entire video. | 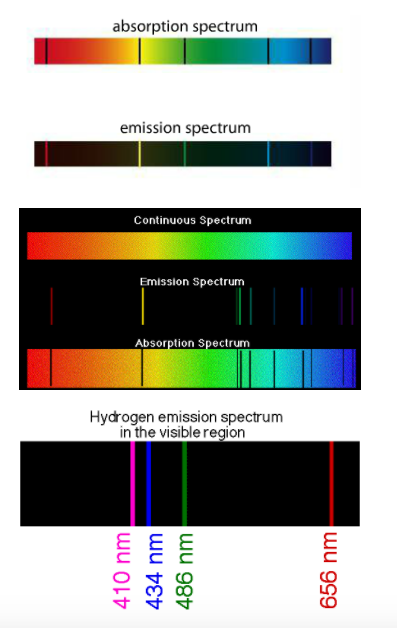 |
Let's play around with average atomic mass. Download this handout. We will have to make adjustments because clearly, we don't have M&Ms, Skittles or Reese's Pieces.
 RSS Feed