12.1 Electron Behavior
Mission 1: Those Doggone Electrons
Mission Objectives. You should be able to...
1. Define "ionization energy" and explain its patterns on a graph.
2. Solve problems using E = hv.
3. Calculate value of the first IE from spectral data which gives wavelength or frequency of the convergence limit.
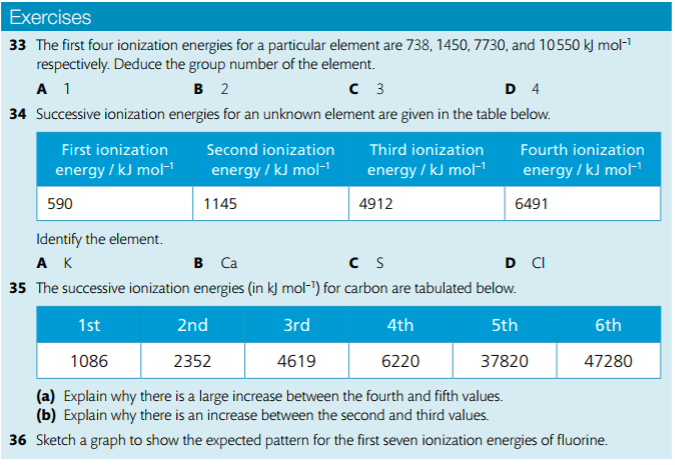
4. Deduce the group of an element from its successive IE data.
5. Explain trends and discontinuities in data on first IE across a period.
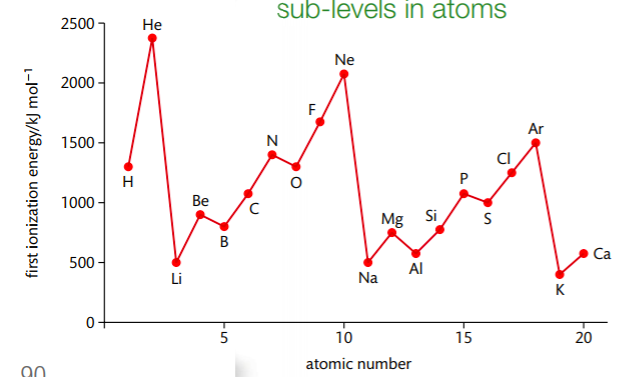
Ionization energy is defined as the energy required to remove one mole of electrons from one mole of gaseous atoms in their ground state. The below graph, from the Pearson (2014) text, shows the first ionization energies of elements 1-20. Examine the graph carefully and identify any patterns you see. How does this graph relate to the structure of the periodic table?
|
Ionization energy (IE) is related to the process X(g) --> X+(g) + e-. Successive ionizations are possible: X+(g) --> X2+(g) + e-. This can go on, as represented by: nth = X(n-1)(g) --> Xn+ + e-. For a given element, the ionization energy increases for successive ionizations in the order IE1 < IE2 < IE3 < IE4 < IE5... This is because it requires more and more energy to remove electrons as you get closer to the nucleus.
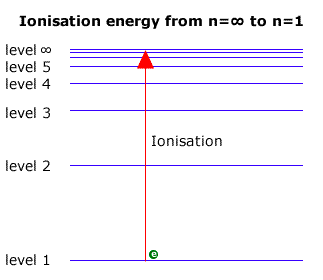
Emission lines converge at higher energies. Look at the figure below. At the limit of convergence, the lines merge and form a continuum. Beyond this, the electron can have any energy because it is no longer under the influence of the nucleus; the electron is outside of the atom because ionization has occurred. |
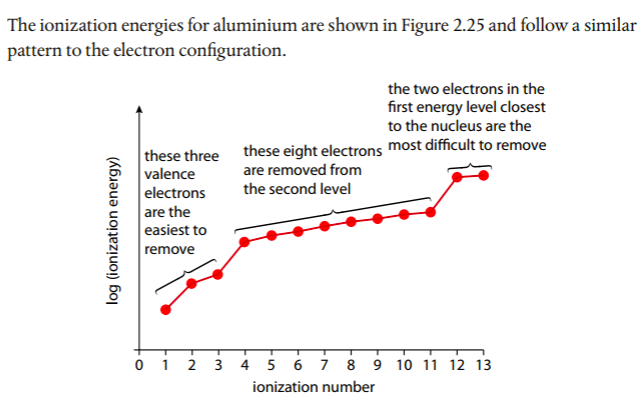
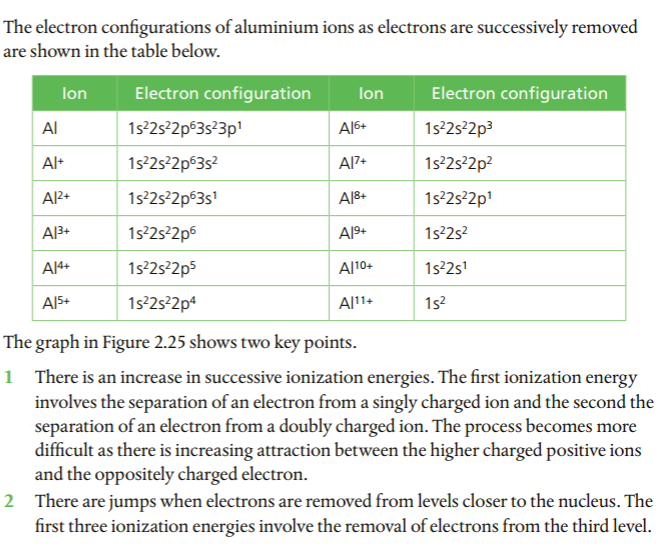
Patterns in successive ionization energies give evidence for the energy levels in an atom. We will use aluminum as an example. Aluminum's first IE is represented by the following: Al(g) --> Al+(g) + e-
The second IE would be: Al+(g) --> Al2+(g) + e-
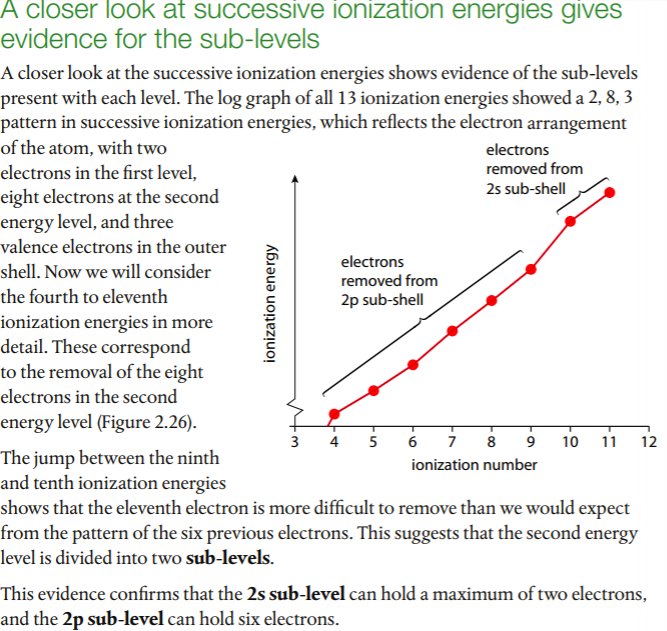
Below is a graph of aluminum's successive IEs from the Pearson(2014) text. Note the jumps between 3rd and 4th and 11th and 12th, which correspond to electrons being removed from lower energy levels. A log scale is used due to the wide range of IE values.
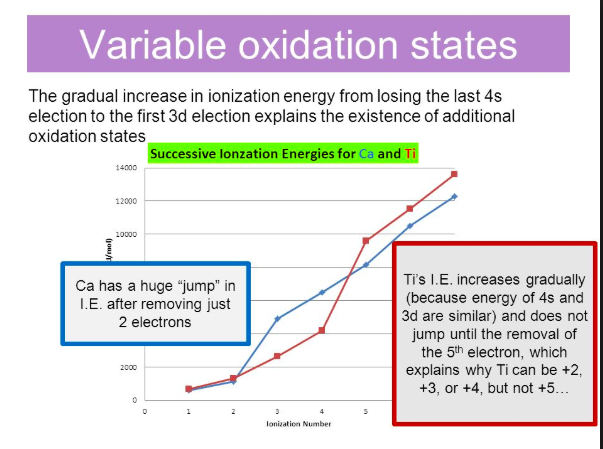
Periodic Trends in IE. The image below shows successive ionization energies for calcium and titanium. In the case of calcium, there is a significant jump going from IE2 to IE3; the third IE corresponds to the removal of an electron from the fully occupied 3p sublevel. As a result, there aren't any Ca3+ ions. Titanium exhibits oxidation states of +2, +3 and +4, with the most stable being +4. The figure shows that there is a large jump in IE for titanium going from IE4 to IE5, which corresponds to the removal of a fifth electron, supporting the observation that titanium doesn't form ions with +5 oxidation states. The IEs increase more gradually than for calcium because electrons are being removed from the 3d and 4s orbitals which are much closer in energy compared to 3p and 4s.
Image courtesy of slideplayer.
Image courtesy of slideplayer.
